複数の棒グラフを表示させるのはpandasが便利
経緯
ある対象に対して、複数のアプローチの結果を可視化したいとき、棒グラフで並べて比較する方法があります。これをmatplotlib.pyplot.bar()で描いていましたが、棒の太さやら目盛の調整が大変でした。matplotlibは柔軟な可視化ができる反面、匠の技が要求されることもあるため、使いこなすのは結構難しいです。より簡単にできる方法はないかと考えていたところ、PandasのDataFrameにmatplotlibのラッパーがあったことを思い出しました。というわけで、復習がてら載せておきます。
可視化する対象
幾つかのモデルの回帰係数の値を可視化します。使用データは、ボストン近郊の住宅情報、モデルは線形回帰、Lasso、Ridge、Elastic Netの4種類です。Lasso、Ridge、Elastic Netは罰則付き回帰と呼ばれる手法で、目的関数に罰則項というモデルの複雑さを調整する項を入れることで、過学習を緩和させることが目的の一つです。手法によって、特定の重要でない変数に対する回帰係数が0になったり、係数が全体的に縮小する、などバリエーションがあります。今回は、代表的な3手法の推定結果にどのような違いが出るかを可視化してみます。
可視化
ライブラリのインポート
必要なライブラリたちをインポートしておきます。matplotlibを呼び出していますが、これはグラフの整形に使っています。
# データ加工
import numpy as np
from pandas import DataFrame
# サンプルデータ
from sklearn.datasets import load_boston
# 学習用、検証用データに分割
from sklearn.cross_validation import train_test_split
# 比較対象:線形回帰
from sklearn.linear_model import LinearRegression
# 罰則付き回帰、正則化項をクロスバリデーションで求めるライブラリを使用
from sklearn.linear_model import LassoCV
from sklearn.linear_model import RidgeCV
from sklearn.linear_model import ElasticNetCV
# MSE、R^2
from sklearn.metrics import mean_squared_error
from sklearn.metrics import r2_score
# 可視化
import matplotlib
import matplotlib.pyplot as plt
%matplotlib inline
# きれいに書くおまじない
plt.style.use('ggplot')
font = {'family': 'meiryo'}
matplotlib.rc('font', **font)
サンプルデータ
サンプルデータは、ボストン近郊の住宅情報です。そろそろ使いすぎてデータマートを作る操作が滑らかになってきました。
# データのロード、データマート作成
boston = load_boston()
df = DataFrame(boston.data, columns = boston.feature_names)
df['MEDV'] = boston.target
# 説明変数、目的変数
X = df.iloc[:, :-1].values
y = df.loc[:, 'MEDV'].values
# 学習用、検証用データに分割
(X_train, X_test, y_train, y_test) = train_test_split(X, y, test_size = 0.3,  random_state = 666)
モデル作成、プロット
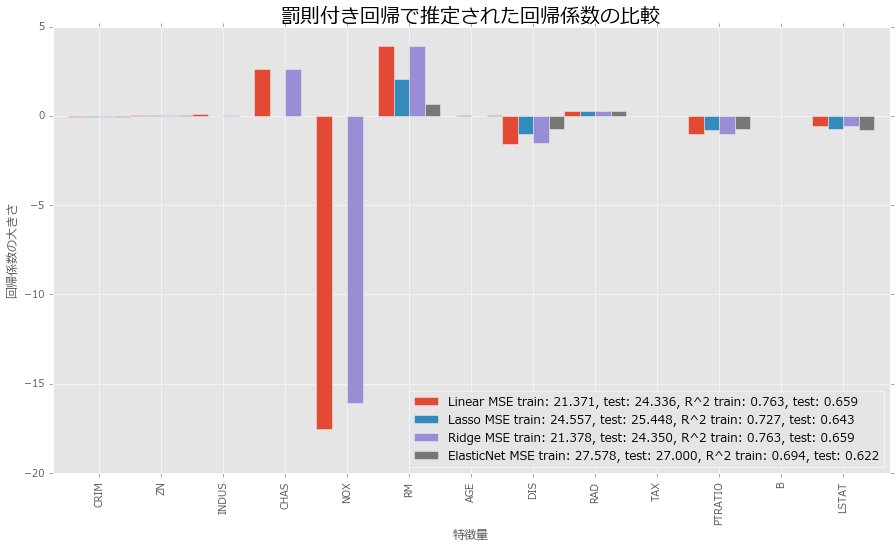
matploblibの場合、プロットしたい対象を一つずつ追加していくという方法が取られます。PandasのDataFrameのplotメソッドは、DataFrameのデータを可視化することができます。棒グラフは、plot(kind = 'bar')と指定するかplot.bar()とすると指定できます。DataFrameに対してこのメソッドを使用すると、indexが横軸で、columnsごとにデータを表示します。今回、4つのモデルの係数に関する棒グラフを表示したいので、DataFrameにはindexには各変数を、columnsには各モデルをラベルするようにデータを格納します。
コード例と結果は以下となります。
# モデルインスタンス生成
Linear = LinearRegression()
Lasso = LassoCV()
Ridge = RidgeCV()
ElasticNet = ElasticNetCV()
# 学習
Linear.fit(X_train, y_train)
Lasso.fit(X_train, y_train)
Ridge.fit(X_train, y_train)
ElasticNet.fit(X_train, y_train)
# 予測値
y_train_Linear_pred = Linear.predict(X_train)
y_test_Linear_pred = Linear.predict(X_test)
y_train_Lasso_pred = Lasso.predict(X_train)
y_test_Lasso_pred = Lasso.predict(X_test)
y_train_Ridge_pred = Ridge.predict(X_train)
y_test_Ridge_pred = Ridge.predict(X_test)
y_train_ElasticNet_pred = ElasticNet.predict(X_train)
y_test_ElasticNet_pred = ElasticNet.predict(X_test)
# データフレームに格納
df_coef = DataFrame(data = np.transpose(np.array([Linear.coef_, Lasso.coef_, Ridge.coef_, ElasticNet.coef_])),
                    index = df.iloc[:, :-1].columns,
                    columns = ['Linear MSE train: %.3f, test: %.3f, R^2 train: %.3f, test: %.3f'
                               %(mean_squared_error(y_train, y_train_Linear_pred),  mean_squared_error(y_test, y_test_Linear_pred),
                                 r2_score(y_train, y_train_Linear_pred), r2_score(y_test, y_test_Linear_pred)),
                               'Lasso MSE train: %.3f, test: %.3f, R^2 train: %.3f, test: %.3f'
                               %(mean_squared_error(y_train, y_train_Lasso_pred),  mean_squared_error(y_test, y_test_Lasso_pred),
                                 r2_score(y_train, y_train_Lasso_pred), r2_score(y_test, y_test_Lasso_pred)),
                               'Ridge MSE train: %.3f, test: %.3f, R^2 train: %.3f, test: %.3f'
                               %(mean_squared_error(y_train, y_train_Ridge_pred),  mean_squared_error(y_test, y_test_Ridge_pred),
                                 r2_score(y_train, y_train_Ridge_pred), r2_score(y_test, y_test_Ridge_pred)),
                               'ElasticNet MSE train: %.3f, test: %.3f, R^2 train: %.3f, test: %.3f'
                               %(mean_squared_error(y_train, y_train_ElasticNet_pred),  mean_squared_error(y_test, y_test_ElasticNet_pred),
                                 r2_score(y_train, y_train_ElasticNet_pred), r2_score(y_test, y_test_ElasticNet_pred)) ])
# プロット
df_coef.plot.bar(figsize = (15, 8), width = 1)
plt.title('罰則付き回帰で推定された回帰係数の比較', size = 20)
plt.xlabel('特徴量')
plt.ylabel('回帰係数の大きさ')
plt.legend(loc = 'best')

いい感じに横に並べることができました。ちなみに、棒の太さはwidthでいじることができ、デフォルトは0.8です。これを大きくしすぎると、棒グラフどうしがかぶってしまって何のことやら…という状態になるので、振る舞いを見てちょうどよい値を選択すると良いと思います。
回帰係数の結果ですが、Lassoは重要でない変数が0になる、Ridgeは線形回帰と少し似ているが、全体的に係数のサイズが小さめ、Elastic Netはそれらの折衷案、のような振る舞いをしています。また、MSEとを見ると、LassoとElastic Netは学習データの精度を少し犠牲にして汎化性能が向上しているようには見えます。ただし、全体的に線形回帰と比較して精度が落ちているため、これらの間で何を採用するかは悩ましいところです。
他のプロット
pandasのplotだけでも工夫するといろいろといじれます。例えば、以下が参考になると思います。
matplotlibを使いこなして職人になるのもよいですが、時間の制約があった場合はこういった便利なラッパーを使うとよい場面があるかもしれません*1。